ZCGViewer
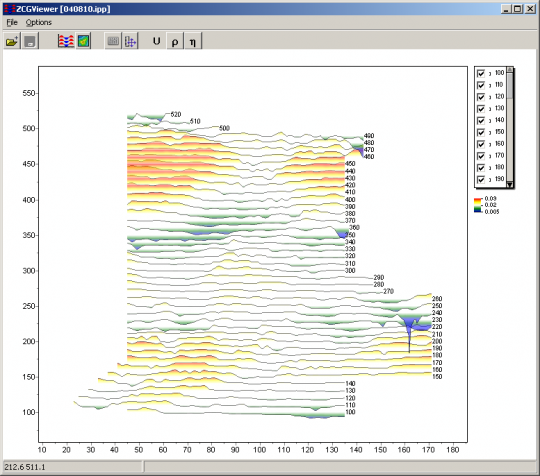
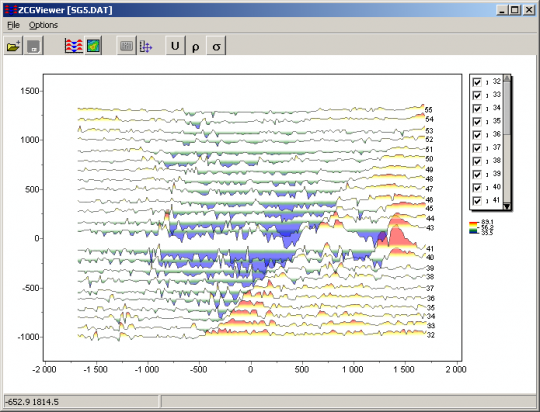
ZCGViewer software is designed for calculation and visualization of apparent resistivity graphs obtained with any electromagnetic profiling systems. The following measurement system: the loop-loop line-line, the line is a loop, the loop line.
The software allows you to visualize the calculated apparent resistivity as of graphs and contour maps. Images are taken into account the coordinates of each point of measurement and so it is possible to use any arbitrarily oriented system profiles. The program also allows you to display results of the areal geophysical surveys, including gravity, magnetic or MG-IP.
ZCGViewer uses simple and clear data format which allows easily combining various systems of observation.
Convenient interface and variety of data visualization features allow to solve wide range of geological problems with maximum effectiveness.
Version 23 / 7 / 2017 | Software: download

